###
PREVIOUSLY:
- CENSUS RESULTS! The Northern Part of the County Has Boomed, and It’s Going to Make Local Redistricting a Little Tricky
- Redistricting Surprise? The County’s Advisory Committee is Looking Seriously at a Plan That Would Move a Distant Quarter of Eureka Into Arcata’s Supervisorial District
###
Late Friday afternoon, the California Center for Rural Policy — the Humboldt State-based organization that is helping the county draw its new electoral maps — released the first set of draft plans that’ll go before the county Redistricting Advisory Committee next week.
What do we have? Let’s take a look.
In all, they’ve published three draft supervisorial maps, largely based on the feedback the advisory committee has received to date. (Which has been relatively little.) Two of these maps are a dramatic departure from the way the county has been divvied up in the past, which the third more or less follows traditional lines, with a few tweaks to adjust for population trends.
The County of Humboldt is currently soliciting feedback on these draft maps. You can submit yours at this link, and/or attend the next meeting of the county’s Redistricting Advisory Committee, which has been rescheduled to Friday, Oct. 15, at 10 a.m. Check this page for an agenda and Zoom links when they become available.
The Humboldt County Board of Supervisors will have final say over any approved map, and is currently scheduled to hear feedback from the Redistricting Advisory Committee some time in November. Since there’s a Dec. 15 deadline
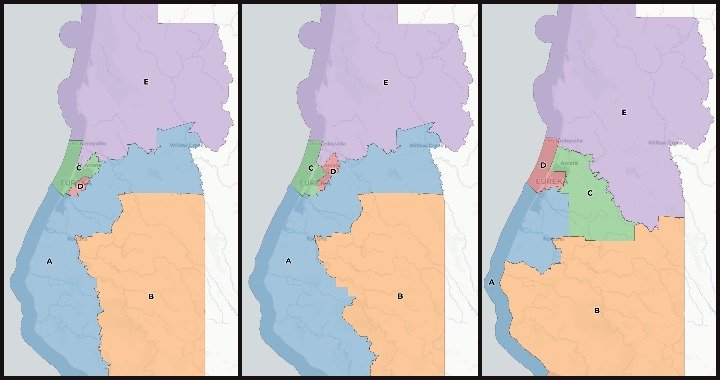
So let’s take a look at these new plans. As a refresher, here’s the status quo:
Unfortunately, the draft plans, which follow, are currently only available in PDF format, which we can’t plot on a map as above. We’ll update with better maps when we can. (UPDATE, Tuesday morning: The County has now published better maps. They’re included below.)
If you’re looking for further demographic detail on each of these plans, click the link at the end of each section below. They’ll give you the full numeric rundown on the population of each of these proposed maps by raw numbers, race and ethnicity. With one exception, that is — the mapmakers neglected to analyze the Native American population, a major faux pas that will surely be corrected shortly.
Draft Plan A
The first of these draft maps is the one we foreshadowed last week, when we wrote about the out-of-left-field push by a couple of citizens to incongruously unite the city of Arcata with the northwest corner of Eureka.
The first thing to say about Draft Map A is that, as it stands, it is probably illegal. California Elections Code requires that …
[t]o the extent practicable, supervisorial districts shall be geographically contiguous. Areas that meet only at the points of adjoining corners are not contiguous. Areas that are separated by water and not connected by a bridge, tunnel, or regular ferry service are not contiguous.
This is the case here — they are not contiguous — though Redistricting Partners, the out-of-town consulting firm that drew these maps, probably wouldn’t have any way of knowing it. Though the map tries to use the peninsula and the Samoa Bridge as connectors between the two disunited lobes of what they refer to as “District C,” it doesn’t quite pull it off. This District C cuts off at Waterfront Drive, which passes underneath the bridge; you have to be in nearby District D to actually get on the bridge.
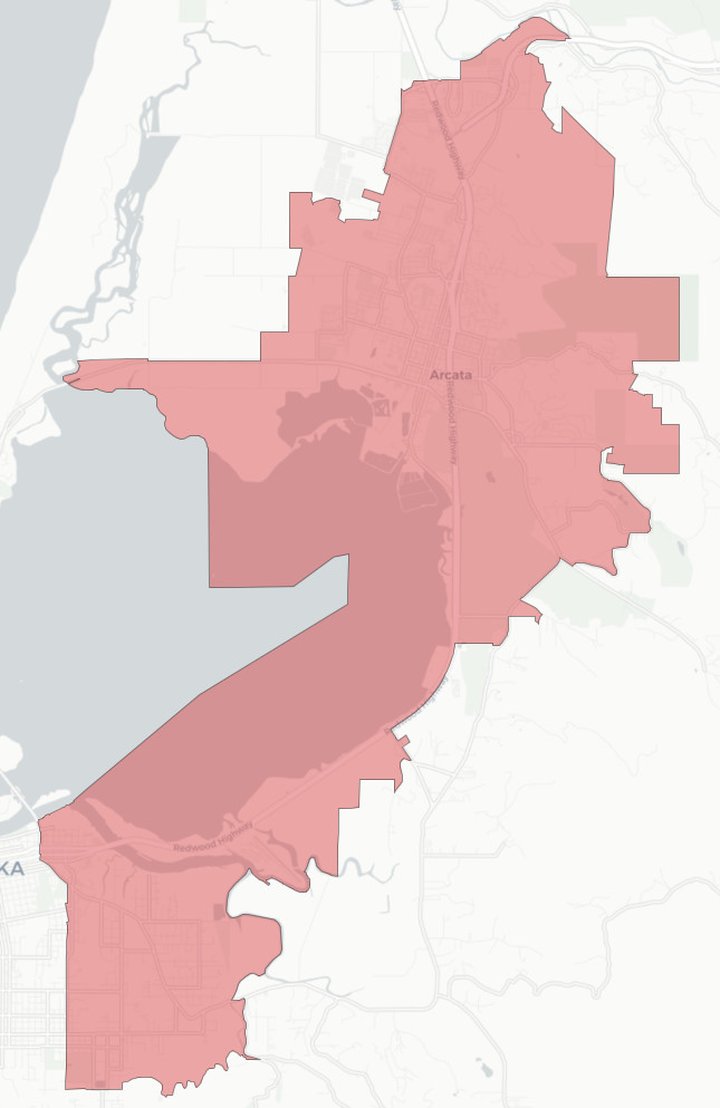
Plan A’s Third District.
That’s a small point and one easily adjusted-for, though. The map is a radical adjustment to the way things are — and not only for its most radical feature, which is the Arcata-Samoa-West Eureka reacharound that ends up dividing Downtown and Old Town Eureka in two. (To compensate, Eureka reclaims Henderson Center and south, including Pine Hill, Rosewood and Lundbar Hills.)
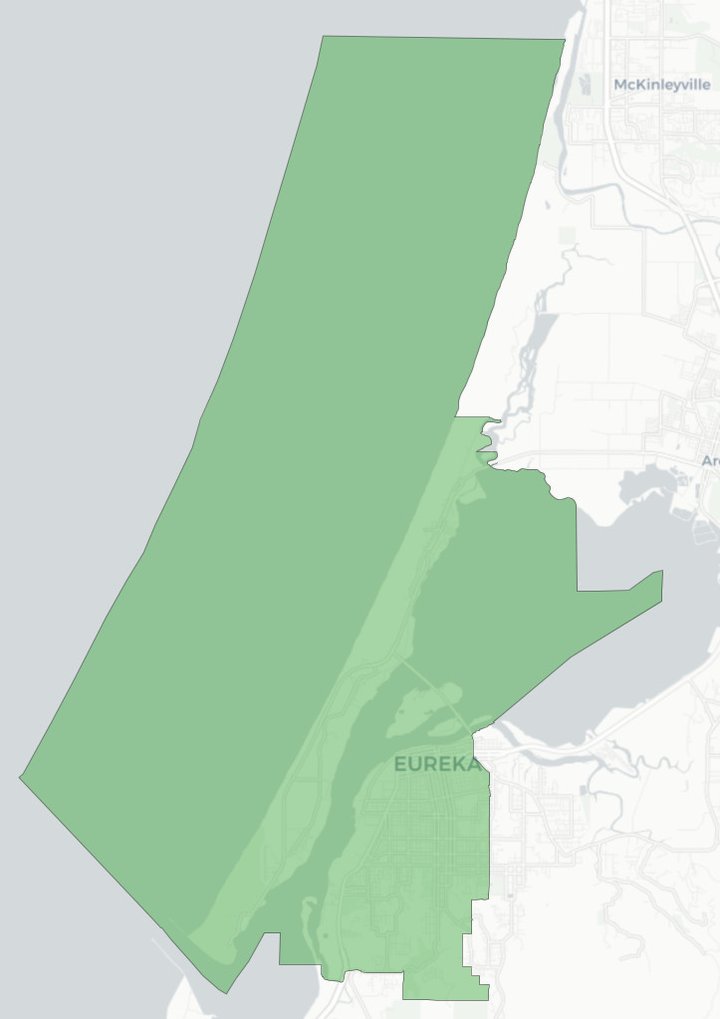
Plan A’s Fourth District.
In addition, it removes the Arcata Bottoms from Arcata’s district, giving them to McKinleyville, and creates a vast, sprawling beast of a thing out of what is currently Rex Bohn’s First District. The First would begin all the way up north in Willow Creek, jog down to Blue Lake, take in Fickle Hill and Kneeland and touch at Indianola before swerving around to Cutten, jumping Highway 101 to Loleta and Ferndale, and then shooting down the Lost Coast through Honeydew and Petrolia … all the way to Shelter Cove!
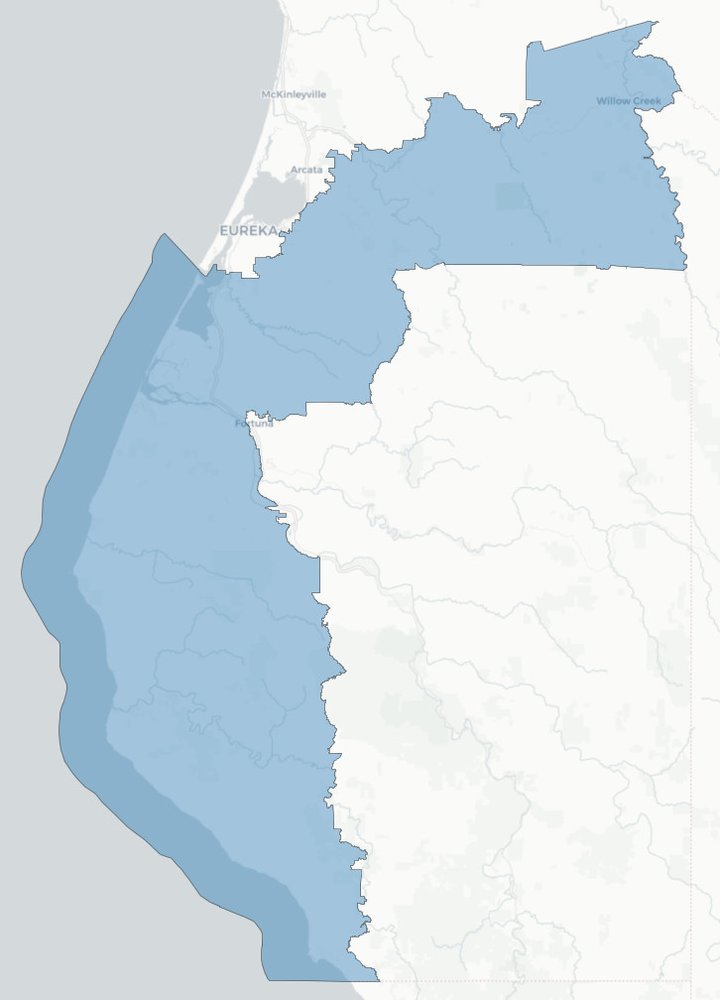
Plan A’s First District.
To compensate for the loss of Shelter Cove, Draft Plan A offers the the SoHum-centric Second District — here called “District B” — the current First District’s famous protuberance up the Eel River Canyon … including, possibly, Scotia? It’s not clear to me from the low-res maps we have been provided.
Download the full Draft Plan A presentation at this link.
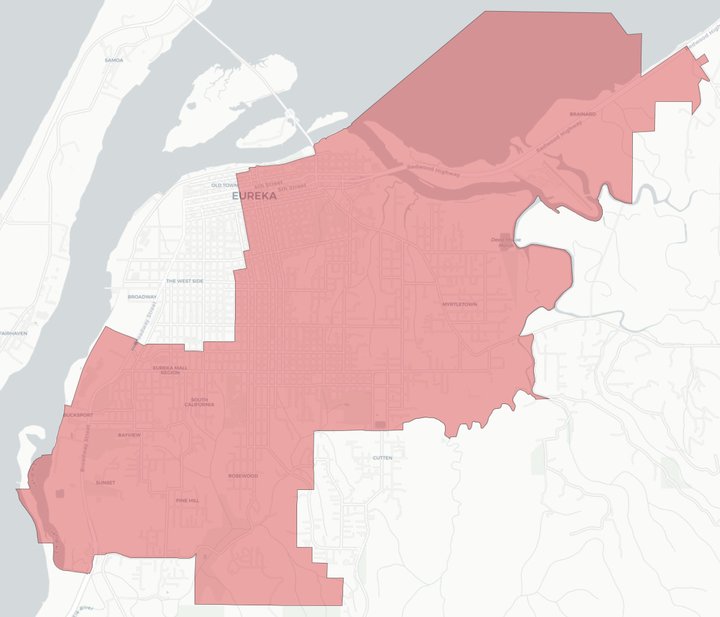
Draft Plan B
As with Draft Plan A, which it resembles in most particulars, the goal of Draft Plan B seems to be to pack city-dwellers around Humboldt Bay into as small a space as possible. In this case, it seeks to accomplish that goal by adding Myrtletown and the east side of Eureka, rather than the city’s northwestern quadrant, to the Arcata-centric district. In this case, Eureka would assume control of the entire Samoa Peninsula.
The rest of the map is, to the naked eye and without the ability to zoom in further, nearly identical to those presented in Draft Plan A, though the border between the First and Second districts (in blue and yellow) shifts a bit. McKinleyville snatches up the Arcata Bottoms. The current First District still cuts that broad and odd parenthesis from Willow Creek to Shelter Cove.
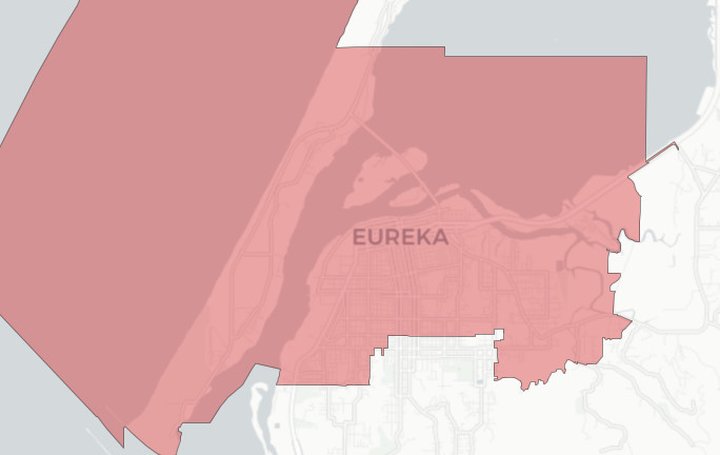
Plan B’s Third District.
Plan B’s Fourth District.
Download the full Draft Map B presentation at this link.
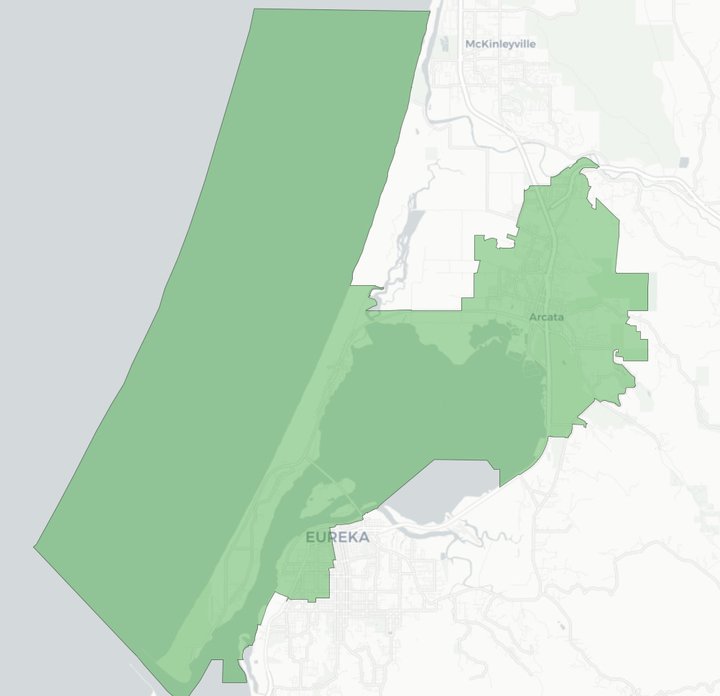
Draft Plan C
Draft Plan C is very close to the current 2010 map, with a couple of small adjustments. Eureka dashes out eastward a little bit to take in more of the Myrtle Avenue corridor and the First District is, for some reason, lopped off somewhere north of Petrolia, which moves into the Second. (That strip of blue you see running south is pure ocean.)
Plan C’s Fourth District.
With these low-resolution maps, it’s not clear to me where the First makes up for that loss of population in the Mattole. (UPDATE: Now, with the new maps it is clear — the new First takes in part of Fortuna.) But in addition to being the least radical option on the table, Redistricting Partners calculates this to be the most population-balanced of the maps, with the largest variance being within 2.2 percent of the ideal. (The Arcata-centric district has 2.2% more people than would be ideal.)
CLICK TO MANAGE