The recent rains carried water and sediment into the South Fork of the Eel River near Phillipsville. (Photo by Kym Kemp)
As Humboldt folk uncurl in the sunshine and contemplate the recent downpours, let’s look at North Coast rivers and streams. Did they get topped off? Are they plump with water? Can we relax a bit?
The USGS WaterWatch site shows that the two gauges on rivers in the northwest of this county are at normal levels as of today’s date. But, the south and mid county flow gauges depict frighteningly low volumes of water. Click on the link. A series of dots indicate by their color how close to average water flows are for each gauge—green is normal, yellow below normal, and red is far below normal. Of the twelve gauges thus ranked in our county, two near the northwest coastline are green. The rest are yellow (3) or various shades of red.
Hovering over each dot shows a compilation of data. The one bright red dot is Bull Creek near Weott. Today’s readings show that the water flows are only at 7% of the average for this time of year. The Eel River at Scotia is only at 23% of average for this time of year. The Mad River near Arcata is at 37% of average flow.
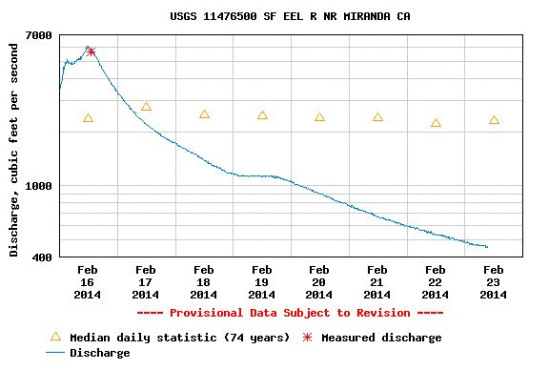
Clicking on each dot allows access to even more information including a graph showing the recent water flows compared to the [median] flows. Most graphs look similar to the one below for the Eel River at Weott.
The yellow triangles show the [median] flows for the site and the blue line shows the flow for the last 8 days.
The recent rainfall spiked the water flows to above normal levels for a very short time. But, once the rains stopped, the flows plummeted to far below normal.
So that’s the bad news.
There is some good news though. Indications are that at least a portion of land owners are purchasing and installing water storage. To get a feel for how that looks on the ground (this is by no means a scientific study only a quick look to provide context), we contacted Dazey’s Supply in Redway. They show a marked increase in sales of water tanks this year. As an example, last year, in February, they sold one 3000 gallon tank. This year, they’ve sold eleven. Last year in February, they sold no 2500 gallon tanks. This month, they’ve sold 25 already.
(For more on ways to store water and improve impacts on the land, go to the Best Management Practices: Northern California Farmers Guide.)


CLICK TO MANAGE