If you were anywhere near Facebook this weekend, chances are you came across the following interactive map from the Oregonian newspaper:
This map is a centerpiece of the Portland-based newspaper’s package on gun violence in the United States in the wake of Roseburg. It purports to show rates of firearm-related death throughout the USA between the years 2004 and 2010, broken out by county.
If you zoom in to our state, you’ll see the map indicates that Humboldt County had the second-highest level of gun-related deaths in California during that period — second only to Del Norte. This fact is what prompted many locals to share it to their Facebook friends.
However: It is not so.
We started digging into the Oregonian’s numbers this morning because we were curious what made Humboldtians so much more likely to be killed by guns than the rest of the state during the period under study. Was it due to homicide? Suicide? Accident? All those types of death by firearms are taken into account in the Oregonian’s figures, which come from the Centers for Disease Control.
But we didn’t get too far before we discovered that if you’re looking for actual gun-related death statistics by county, this map is not the place to look. Either you have the wrong expectations for it, or the Oregonian used the wrong data. And since the Oregonian calls this map “U.S. gun deaths, 2004-2010,” and says that it shows “the average number of gun deaths per 100,000 county residents from 2004 through 2010,” we kind of have to go with the latter. It doesn’t show that, exactly.
In fact, the Oregonian is using what the CDC calls “geospatially smoothed” data. When the data is “geospatially smoothed,” the CDC takes each county’s actual rates of death by firearm and averages those with the actual rates of neighboring counties. Every county is its brothers’ keeper. The goal, here, is to show an average for a region, not actual numbers by county.
It turns out to make a pretty big difference.
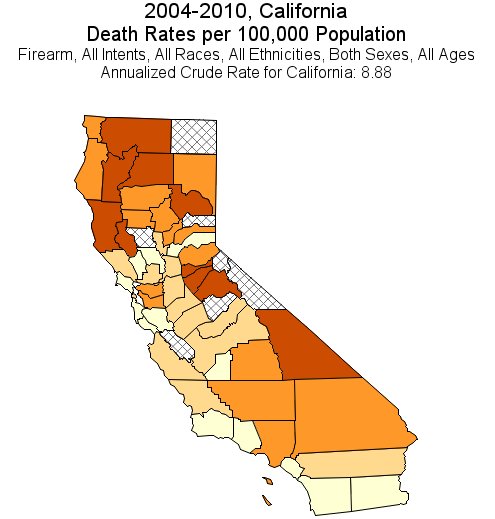
Not “smoothed”
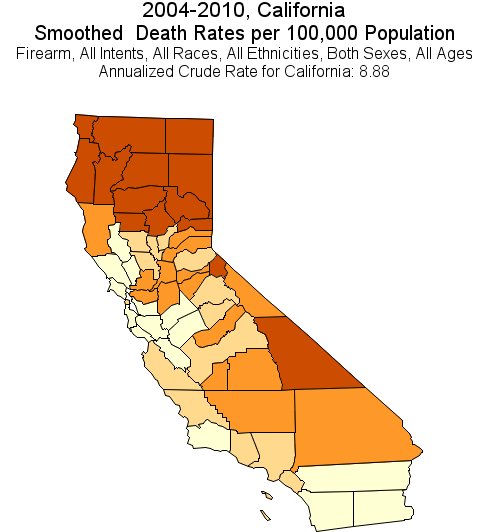
“Smoothed”
Here we see the before-and-after of geospatial smoothing. On the left: Humboldt and Del Norte’s actual rates of death by firearm; on the right, the rates after they are averaged out with their neighbors (as employed by the Oregonian.) We see, here, that Del Norte and Humboldt did not have the most firearm-related deaths in those years at all, as the Oregonian would have you believe.
In fact, neither county made the top 10. Actually, Humboldt had the 11th highest rate of firearms deaths in California, not the second highest. Poor little Del Norte didn’t have the #1 highest rate of gun deaths per capita, but the 23rd highest. (That’s with seven counties left out for “Suppressed/Unstable/Undefined” data, likely due to the low populations in those counties.)
Mostly this is because Siskiyou and (especially) Trinity counties are off-the-charts bad. Their numbers got smoothed into ours. We ended up looking worse for it and they ended up looking better. Here are the actual rates of gun-violence deaths in northwestern California counties between 2004 and 2010, with statewide rank attached:
1. Trinity: 34.706 deaths per hundred thousand per year
2. Siskiyou: 28.803
8. Mendocino: 15.323
11. Humboldt: 13.043
23. Del Norte: 10.576
Here are the same ranks and figures — the ones used in the Oregonian map — post-smoothing. Note how the rankings are flipped.
1. Del Norte: 16.014
2. Humboldt: 15.557
5. Siskiyou: 15.097
6. Trinity: 14.850
22. Mendocino: 10.410
Check the numbers for yourself at this CDC website. Choose “firearm” as the “mechanism of injury,” then choose California as your state.
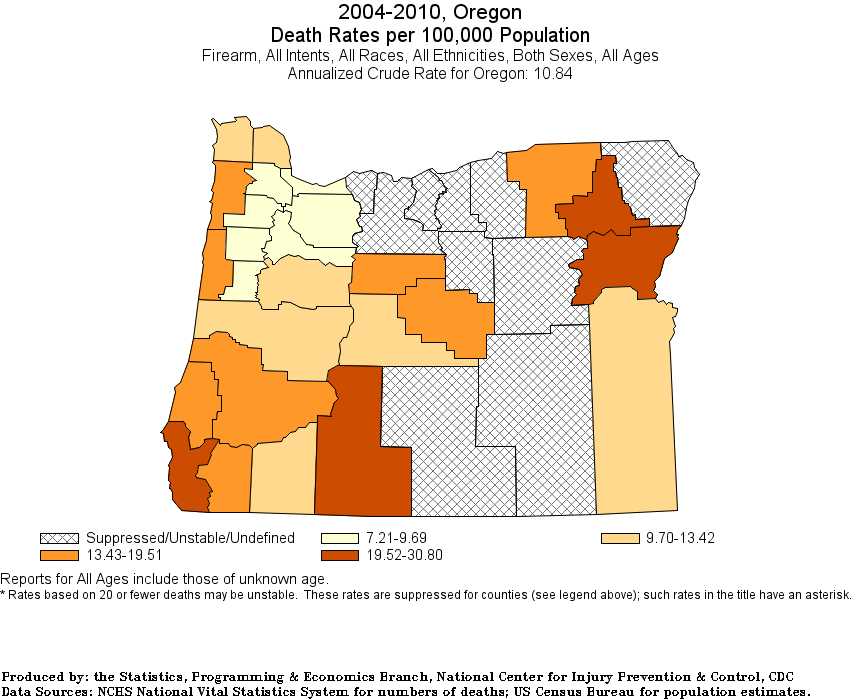
Why did the Oregonian used “smoothed” rather than actual data, when the actual seems to be what the map is driving toward? Unknown. Maybe it was an error. Or maybe it was due to the fact that the CDC doesn’t have data for a lot of Oregon counties:
# # #
UPDATE, 3:15 p.m.:
Less than an hour after this post went up, the Oregonian updated its story to reflect that, yes, they used “smoothed” county death rates rather than the actual county numbers, thereby loaning Humboldt and Del Norte counties the gun deaths of our neighbors.
CLICK TO MANAGE