There’s actually some pretty useful mapping sites out there anyone with an Internet connection can utilize to get a better idea as to the size and location of the wildfires burning in Humboldt and Trinity counties. Sharing is caring.
WildlandFire lays daily fire perimeters released by the USGS over the most readable maps we’ve found thus far. The following screen shots illustrate the latest available established perimeters for the major fires in our region.
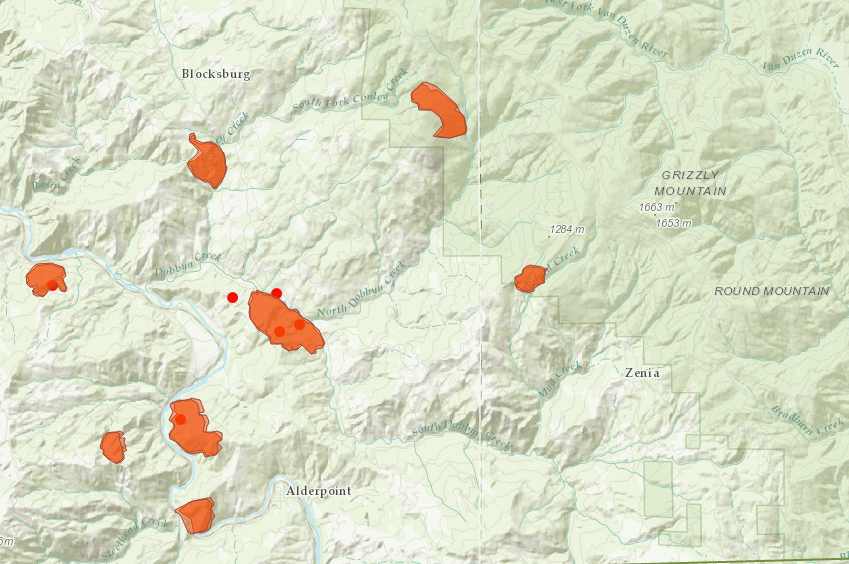
Southeastern Humboldt
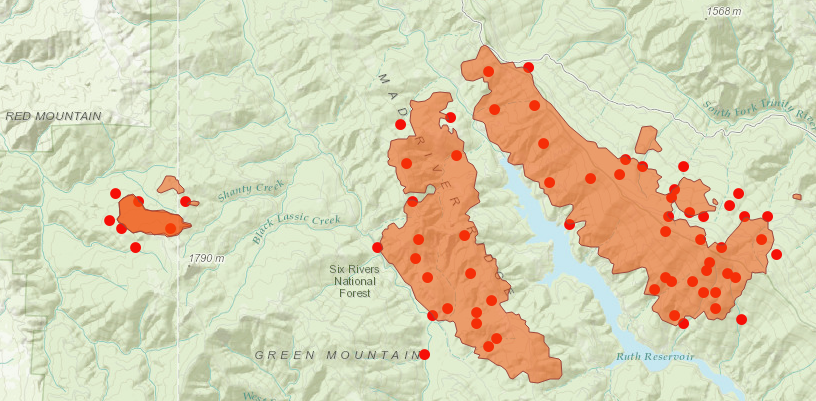
Ruth Lake
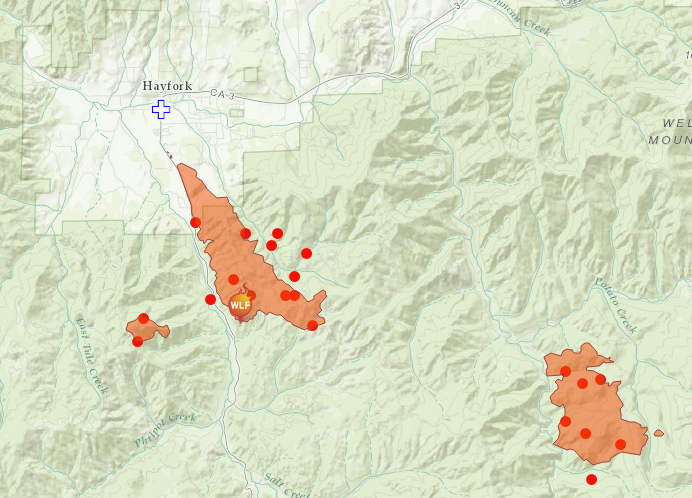
South of Hayfork
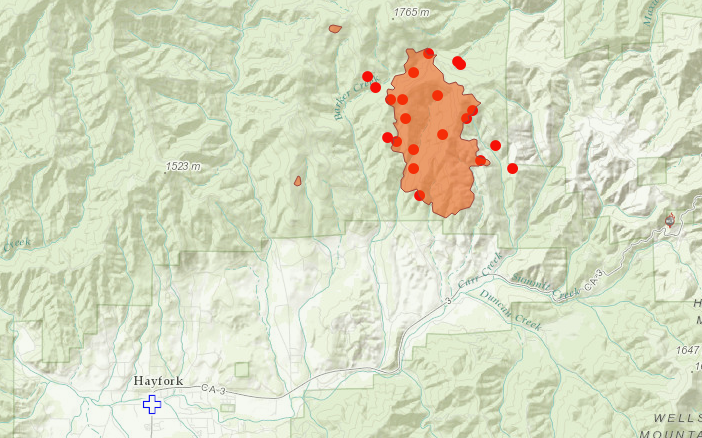
North of Hayfork
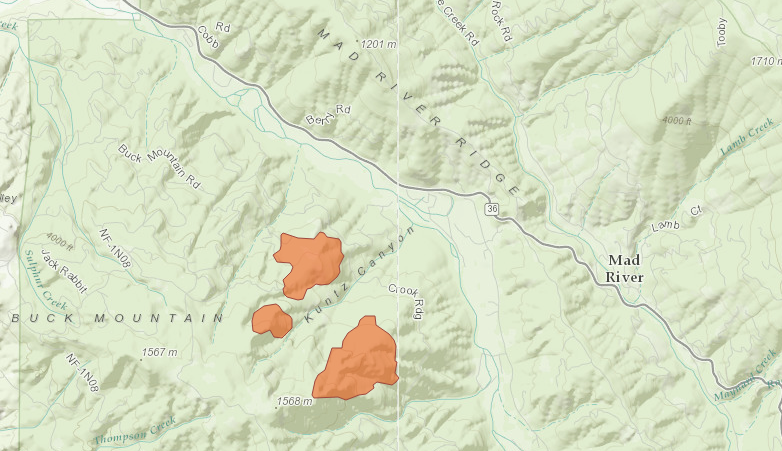
Mad River
Another handy tool is the US Geological Survey’s GeoMAC site which features MODIS thermal satellite data. We’re still trying to get an answer as to how often this data is refreshed, but it can give you a good idea of where the current hot spots are as opposed to places that have already burned.
Let’s take a look:
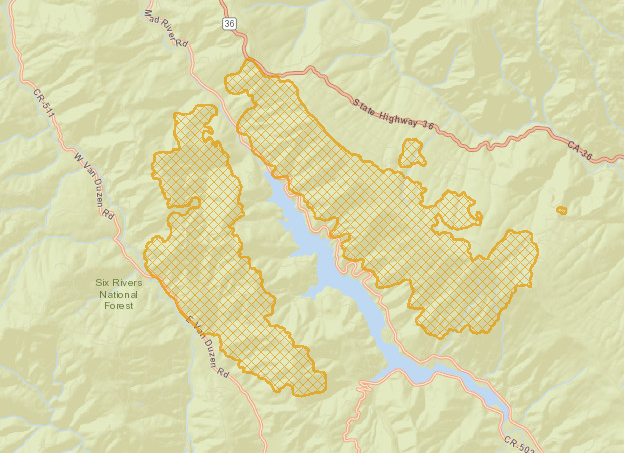
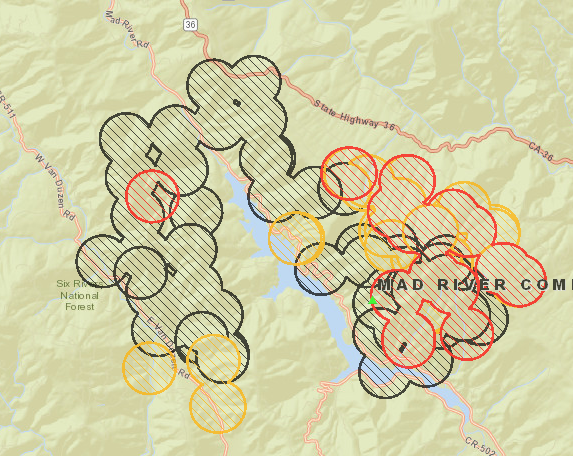
The first map provides us the most recent fire perimeter. The second shows us the most recent MODIS thermal data. As far as we can tell, red circles indicate areas where extreme heat was detected most recently while black circles are areas that were hot in the recent past (48 hours ago in many cases. You can more data by activating “Identify” over the map and then clicking the data points).
(h/t Redheaded Blackbelt)
CLICK TO MANAGE