[For LoCO’s chronological list of fire updates, go here.]
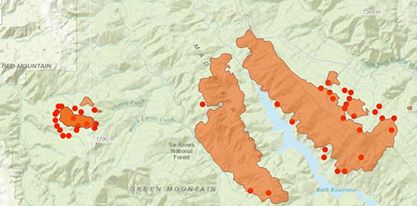
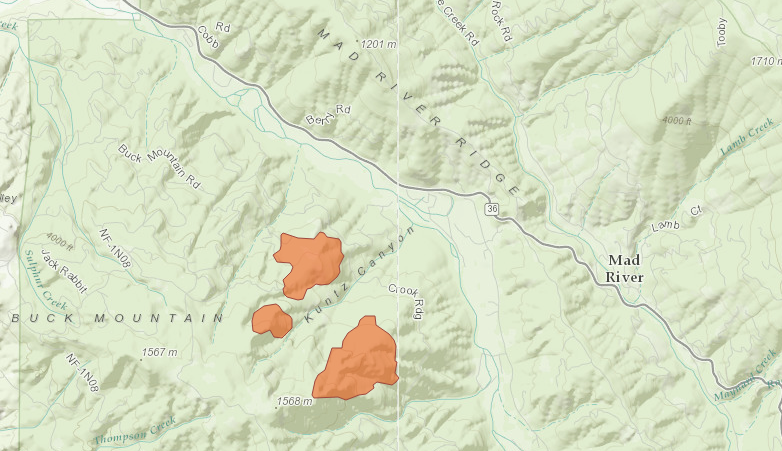
Map of the fire footprint around Ruth Lake. The red dots indicate the most recent “hot spots” detected by satellite.
The group of fires currently burning in the Ruth Lake/Mad River area has now burned 13,157 acres, according to this morning’s estimates from the incident command team in charge of the fires. Over 600 firefighters and support personnel have now been assigned to the fire.
Despite some reports to the contrary, Highway 299 remains open, according to Caltrans District One public information officer Eli Rohl.
The town of Blocksburg remains under an “evacuation advisory,” as the fire to its south continues to grow.
Up north of Highway 299, the “River Complex” of fires — sparked by the same lightning storm that passed through the interior Thursday and Friday — have grown to 3,745 acres as of this morning, with the town of Denny under voluntary evacuation orders and firefighters preparing for a stand:
Firefighters are focused on preparing and defending structures in the area of Denny, Dailey and Hoboken. They are also maintaining access into Denny after a large tree fell across Denny Road last. There are many hazard trees throughout the fire area posing a danger to firefighters and motorists.
The National Weather Service has a “hazardous weather outlook” up for the North Coast interior that calls additional lightning storms today and tomorrow a “possibility” — mostly north of 299.
###
There are actually some pretty useful mapping sites out there anyone with an Internet connection can utilize to get a better idea as to the size and location of the wildfires burning in Humboldt and Trinity counties. Sharing is caring.
WildlandFire lays daily fire perimeters released by the USGS over the most readable maps we’ve found thus far. The following screen shots illustrate the latest available established perimeters for the major fires in our region.
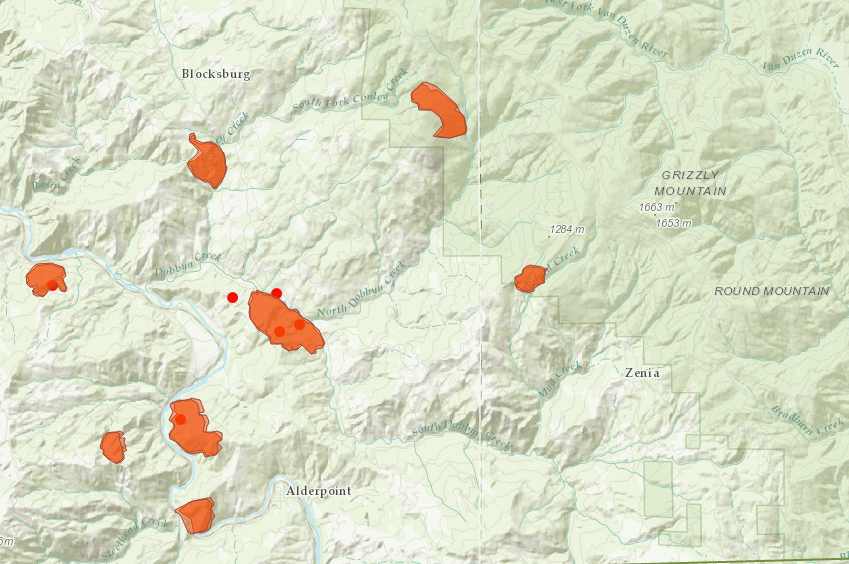
Southeastern Humboldt
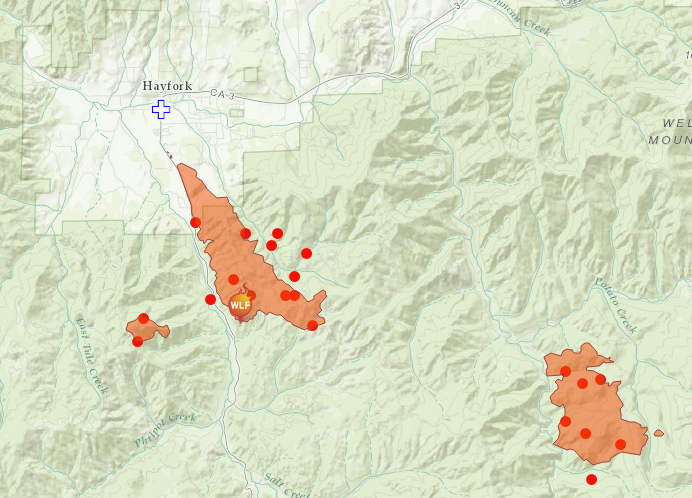
South of Hayfork
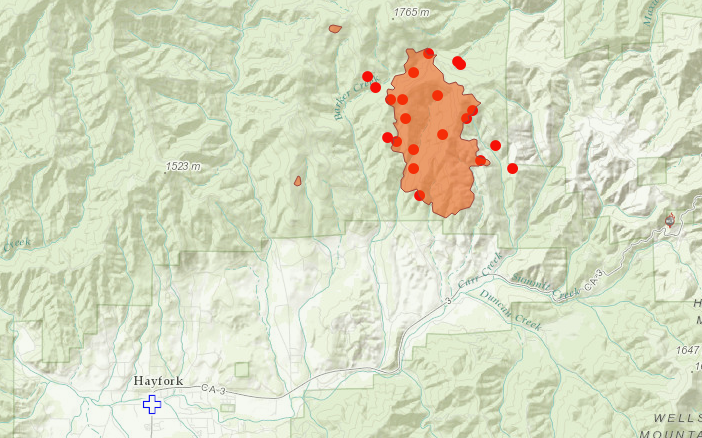
North of Hayfork
Mad River
Another handy tool is the US Geological Survey’s GeoMAC site which features MODIS thermal satellite data. We’re still trying to get an answer as to how often this data is refreshed, but it can give you a good idea of where the current hot spots are as opposed to places that have already burned.
Let’s take a look:
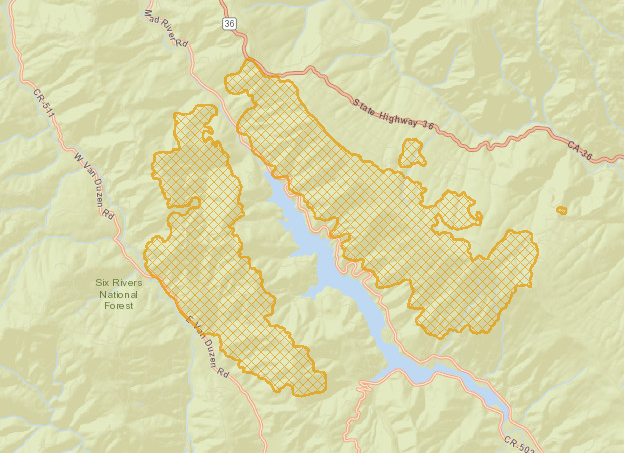
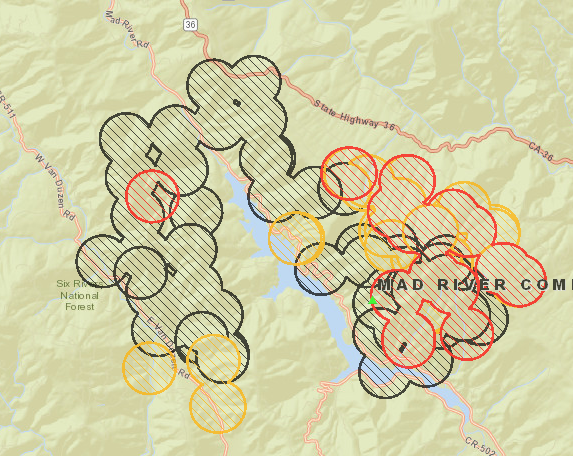
The first map provides us the most recent fire perimeter. The second shows us the most recent MODIS thermal data. As far as we can tell, red circles indicate areas where extreme heat was detected most recently while black circles are areas that were hot in the recent past (48 hours ago in many cases. You can more data by activating “Identify” over the map and then clicking the data points).
— Andrew Goff
(h/t Redheaded Blackbelt)
###
MOST RECENT FIRE COVERAGE:
- VIDEO: Calfire Report Shows Footage of “Massive” 47,000-Acre Rocky Fire
- Sunday Lightning Fires Update: Ruth Lake Fires at 11,000 Acres; More Firefighters Arriving Today
- Evacuation Center Established for Blocksburg Residents
- Your Update on all Things Fire; Calfire’s ‘The Fire Situation Report’ (VIDEO)
- Evacuations Ordered Throughout Trinity County
- VIDEO From Ruth Lake Fire
- Aerial Photos from Ruth Lake Wildfire; Highway 36 Closed at Humboldt/Trinity Line; Power Outages
- Ashes Fall From the Sky All Around Humboldt County
- Picket Fire Grows to 750 Acres; Ruth Lake Campgrounds Evacuated
- PHOTO: This Amazing Photo of a Clearlake Fire Is Not a Photo of a Clearlake Fire
- (UPDATE) Dozens of Small Wildfires Burning in Humboldt County; More Lightning Coming
CLICK TO MANAGE