How many parcels of land in Humboldt County are blown up, you ask?
An edumacated guess: About 3,320, give or take a couple of hundred.
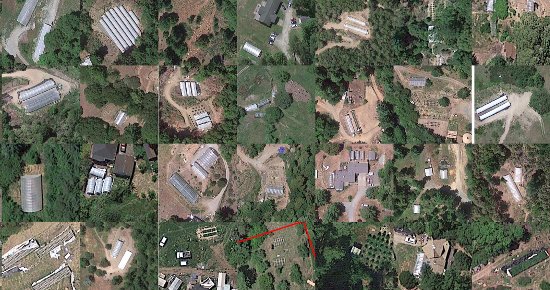
This is the first of the conclusions we will draw from “Weed or No Weed,” a little web game the Outpost launched back in August. The way the game worked was this: Readers were presented with a satellite view of a random parcel of Humboldt County land and invited to vote on whether or not that parcel was home to a marijuana cultivation operation. After a couple of months, over 125,000 votes were recorded.
The point of the exercise, apart from whatever entertainment value people derived from it, was to get some kind of profile of the marijuana industry in Humboldt County at this moment of profound legal flux. Right now, lawmakers in Eureka and Sacramento are attempting to quickly craft rules that will govern an industry that everyone assumes will soon be brought out into the open, following voters’ approval of a legalization initiative on next year’s ballot.
The Humboldt County Planning Commission recently approved a draft regulatory regime that will govern the legal production of cannabis in Humboldt County’s backwoods. The Board of Supervisors will take their first look at this draft at its regular meeting next week (Dec. 15), and will eventually pass, reject or amend this draft.
These elected and appointed officials are in the difficult position of having to act without much solid information on the industry as it exists. Their constituents have even less information. Commercial marijuana production in Humboldt County began in the late 1960s and early 1970s. It boomed following the quasi-legalization of medical marijuana in 1996. Over a half of a century, the industry has grown from the fringes into the mainstream. Cannabis cultivation is almost certainly the largest single sector of the local economy, and is beyond doubt the county’s largest export product. Yet since it belongs to the black market, no one has any sort of hard facts about the industry. Lawmakers are trying to tame the beast without knowing what the beast looks like.
STATE OF THE WEED
- How Many Grows Are There in Humboldt County?
- Can You Guess Where Most of the Weed in Humboldt County is Grown?
- Weed or No Weed Methodology
The “Weed or No Weed” experiment seeks to fill that gap, to the best of its ability, specifically as regards questions of land use and zoning – the issues over which local governments have most power. We are not offering it up as final, Q.E.D.-style answers to the questions we’ll be looking below and over the coming days. Rather, it represents the best, most informed answers to those questions that we are aware of.
There are a few standard caveats that will apply.
- “Weed or No Weed” counted parcels of land, not “grows,” however you wish to define that. Many parcels house more than one set of hoop houses grouped on separate parts of a property. If you think of each of those groups as separate “grows,” then there are many more of those than there are weed-positive parcels.
- We looked only at the subset of Humboldt County parcels that are one acre in size or greater — 28,545 of them. As we will see, this almost certainly accounts for the vast majority of Humboldt County outdoor grows.
- We count only those grows that are plainly visible from outer space.
We began by offering the first of our informed guesses — that around 3,300 properties in Humboldt County host grow ops. How did we arrive at that figure? Here’s a brief rundown of the methodology we have used in analyzing the “Weed or No Weed” data. (A more thorough explanation is available at this link, if you’re into that sort of thing.)
Take a look at the following ugly table, which represents all of the parcels in our study — everything over an acre in size. We’ll be publishing many more of these tables in the coming days, so if you’re interested in the topic, here’s how to read them.
| ALL | |||||||||||
| Counted | |||||||||||
| + | - | Total | |||||||||
| 1,571 | 14,207 | 15,778 | |||||||||
| Sampled | |||||||||||
| + | - | S. Size | Total | ||||||||
| 151 | 951 | 1,102 | 12,767 | ||||||||
| Rate | Confidence Interval |
||||||||||
| 13.7% | 1.94% | ||||||||||
| Totals | |||||||||||
| Sample | Count | Combined | Pop. | % | |||||||
| LO | 1,502 | 1,571 | 3,073 | 28,545 | 10.76 | ||||||
| MD | 1,749 | 1,571 | 3,320 | 28,545 | 11.63 | ||||||
| HI | 1,997 | 1,571 | 3,568 | 28,545 | 12.5 | ||||||
The table comes in three parts: “Counted,” “Sampled” and “Totals.”
The “Counted” section represents those parcels for which voters reached a definitive conclusion. We decided to define “definitive” as those which received at least a three-vote spread in either direction. Did a particular parcel get three “yes weed” votes and zero “no weed” votes? Then it is marked down as weed-positive. Did it receive four “no weed” votes and only one “yes weed” vote? Then it went down as weed-negative. This method took care of the counting of 15,778 of the 28,545 parcels in our “Weed or No Weed” universe — about 55 percent.
Under “Sampled,” we take care of the remaining 45 percent of parcels through standard statistical sampling methods. Your correspondent looked at 1,102 randomly chosen parcels that were not definitively marked either positively or negatively by the crowd, either because they were not served up to the public enough to receive the required number of votes or because they were too controversial. In these cases, I very conservatively made a final call as to whether or not a parcel was weed-positive. If I was at all in doubt, I put it in the negative column.
We see that I marked 151 of the 1,102 properties I was given as weed-positive — about 13.7 percent. We can apply that ratio to the entire population of 12,767 non-“counted” parcels. Statistically, we can be 95 percent certain that the sample ratio represents the entire population, plus or minus 1.94 percentage points. In other words, we can say (with 95 percent certainty) that between 1,502 and 1,997 percent of non-“counted” parcels are weed-positive.
Under “Totals,” we simply add the “counted” and “sampled” subsets, giving us a range of possible figures. Between 3,073 and 3,568 Humboldt County properties grow weed, with 3,320 being the midpoint.
Going beyond a simple headcount: We can break down the totals based on certain characteristics of the properties we have surveyed — by watershed, say, or by current zoning status. For instance: One of the factors that comes into play in the Planning Commission’s draft regulation of commercial marijuana grows is the size of parcels that people grow on. The larger the parcel, the larger the grow. In the draft, parcels between one and five acres in size may only grow 200 square feet of cannabis without a special permit; parcels over five acres may grow 3,000 square feet and more.
Our analysis suggests that very little of the county’s outdoor cannabis production takes place on parcels of less than five acres. See the tables below.
| UNDER FIVE ACRES | |||||||||||
| Counted | |||||||||||
| + | - | Total | |||||||||
| 262 | 4,803 | 5,065 | |||||||||
| Sampled | |||||||||||
| + | - | S. Size | Total | ||||||||
| 18 | 343 | 361 | 4,147 | ||||||||
| Rate | Confidence | ||||||||||
| 4.99% | 2.15% | ||||||||||
| Totals | |||||||||||
| Sample | Count | Combined | Pop. | % | |||||||
| LO | 118 | 262 | 380 | 9,212 | 4.12 | ||||||
| MD | 207 | 262 | 469 | 9,212 | 5.09 | ||||||
| HI | 296 | 262 | 558 | 9,212 | 6.05 | ||||||
| OVER FIVE ACRES | |||||||||||
| Counted | |||||||||||
| + | - | Total | |||||||||
| 1,309 | 9,404 | 10,713 | |||||||||
| Sampled | |||||||||||
| + | - | S. Size | Total | ||||||||
| 133 | 608 | 741 | 8,620 | ||||||||
| Rate | Confidence | ||||||||||
| 17.95% | 2.64% | ||||||||||
| Totals | |||||||||||
| Sample | Count | Combined | Pop. | % | |||||||
| LO | 1,319 | 1,309 | 2,628 | 19,333 | 13.6 | ||||||
| MD | 1,547 | 1,309 | 2,856 | 19,333 | 14.77 | ||||||
| HI | 1,775 | 1,309 | 3,084 | 19,333 | 15.95 | ||||||
About five percent of the county’s roughly 9,200 one-to-five acres properties currently host grows; nearly 15 percent of the 19,000 five-plus properties do.
Over the next few days, we will break down the current state of the weed by watershed, by zoning, and by whatever other metric you suggest (if it is feasible).
Stay tuned!
CLICK TO MANAGE