The current Eureka city electoral map is wildly out of balance.
###
PREVIOUSLY:
- CENSUS RESULTS! Humboldt County Has Grown a Little, and at Least on Paper It’s a Little Less White
- CENSUS RESULTS! The Northern Part of the County Has Boomed, and It’s Going to Make Local Redistricting a Little Tricky
###
It’s taken a little bit longer than expected, for reasons we’ll get to shortly, but here we are a month later with the final episode of CENSUS RESULTS, focused on the City of Eureka. Read all the way to the end – it comes with the reintroduction of a fun and productive LoCO game for you civic-minded Eureka citizens.
Why do the results of the 2020 Census matter? For lots of reasons (federal funding is a big one) but what we want to look at right now is how it matters for redistricting – the process of drawing lines between different electoral districts for legislative purposes. The California Citizens Redistricting Commission is charged with doing that for our state and federal offices – Assemblymember, state Senator, Congressmember – and they’re deep in the middle of that process right now. They have to divvy up the state into sections of roughly equal population so that each section elects its own legislators.
The same thing happens for county supervisors. Each of the county’s five supervisorial districts must be about the same size, so that – for example – Supervisor Mike Wilson represents the same number of constituents as Supervisor Virginia Bass. The lines between the two districts have to be rejiggered every 10 years to realign those population numbers. The Board of Supervisors itself will decide the new boundaries in the coming months, with input from a citizen-led Redistricting Advisory Committee convened for the purpose.
Since 2016, when Eureka adopted the “true ward” system for City Council elections, it has to do the same thing the county does. And as it turns out, it has to do it in very dramatic fashion, as for whatever reason – I’m not discounting poor Census response rates, or some other strange mishap – the official population in each of the city’s five wards vary wildly from each other now.
First, an overview: As you’ll recall, the 2020 Census figures that Eureka shrunk quite a bit over the last 10 years. In 2010, the Census had the city’s population at 27,191. In the 2020 Census, that was down to 26,512 – a loss of 679 souls.
In recent weeks – and on paper, at least – the city has gained some of that back. First, it appears that the Census has incorrectly excluded five census blocks in the Rosewood neighborhood from city limits. (See map here.) When we checked with Riley Topolewski, a senior planner and GIS specialist for city government, he told us that this sort of thing has happened before. In such cases, he said, they have notified the Census Bureau, and the Bureau quickly rectifies its error.
So we’re going to assume, until we hear differently, that those five blocks are actually within city limits. That would add 91 people to the city’s population, for a total of 26,603.
But there’s more, at least as regards the task at hand. California recently passed a law saying that people incarcerated in state prison should not be counted at the prison where they are located, but at their home addresses. The California Department of Justice was charged with providing that data to the California Statewide Database, which would then release revised Census population to redistricters around the state.
The Statewide Database released those figures yesterday, and 90 people so incarcerated were returned to the city of Eureka – not in body, but in spirit. The city’s population, for redistricting purposes, now stands at 26,693.
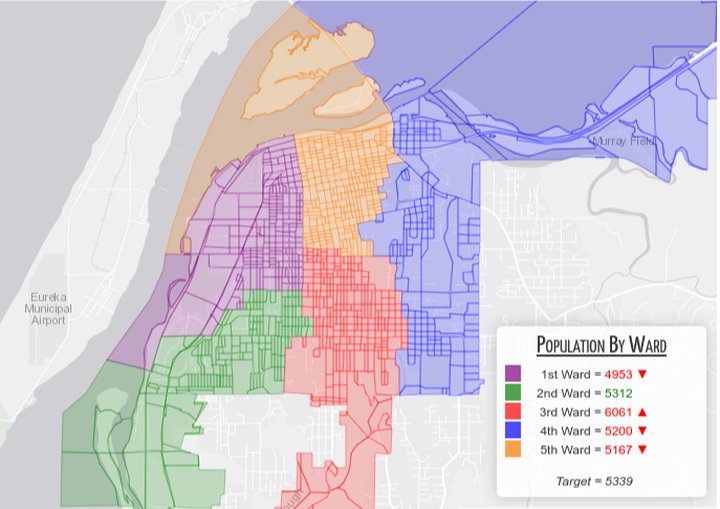
In an ideal world, then, each of the city’s five wards would have exactly 5,338.6 residents. (Let’s round that up to 5,339.) But they do not, at all! Check out how it actually breaks down:
| Ward | Councilmember | Population | +/- |
|---|---|---|---|
| First | Castellano | 4,953 | -386 |
| Second | Moulton | 5,312 | -27 |
| Third | Arroyo | 6,061 | +722 |
| Fourth | Bauer | 5,200 | -139 |
| Fifth | Bergel | 5,167 | -172 |
Big difference! For some reason, the Census Bureau says, Eurekans migrated in droves to the Third Ward (the pink one in the map up top, there) and away from the First Ward (purple), and from the Fourth and Fifth somewhat, too.
The pink ward has to shrink — a lot — and the other ones have to grow. Over the next few weeks, Eureka city staff and the council will work to draw new, equal-proportion maps of the city’s ward, and — if all goes according to schedule — adopt one by the end of the year. They’re also supposed to hold several public forums on the topic.
But why wait? If you remember, the current Eureka Ward Map was drawn right here on the Outpost four years by an anonymous user called “MAD Balancing Act” four years ago. Using our cool tools, MBA drew his fantasy ward map — and when the city council and its advisory committee saw it, they promptly tossed out all other alternatives and made it so.
So let’s do that again! The cool tool has been recharged for 2020, and you can find it at this link. Draw your own damn map! Be your own redistricter! A full set of instructions can be found at this link, but it’s pretty simple. Pick a map you like — either the current City map or one of the ones seeded by LoCO staff. Clone it. Name your cloned map. Start clicking to transfer census blocks to neighboring wards. When you’ve got it how you like it, and when all wards are balanced and contiguous (meaning every block in every ward is geographically connected to the other blocks in that ward), then go ahead and publish that sucker! Tell us your reasoning in the “description box.” You can’t do it on your phone, I don’t think.
→ ONCE AGAIN, LoCO REDISTRICTING 2020 EDITION CAN BE FOUND AT THIS LINK ←
Finally: You say you wish there were a similar cool tool for the county Board of Supervisors districts? There is! Click over to the “Districtr” app and map your county right there — your feedback will go directly to the county’s Redistricting Advisory Committee.
CLICK TO MANAGE